1. Introduction
While the field of music visualization is a catalyst for the digitization in the music domain – motivating to collect and digitize data (Khulusi et al. 2020a; Khulusi et al. 2020b; Pattuelli et al. 2013) –, musicology as a research field still focuses on analog data in daily workflows. In a recent state-of-the-art-report, visualizations for different types of music data are shown, giving insight into the developments of the last two decades (Khulusi et al. 2020b). As stated in this survey, the German musiXplora project links the digitization and visualization of musicological data. While our previous works focused on visualization aspects of the project (Jänicke / Focht 2017; Jänicke et al. 2016; Khulusi et al. 2018; Khulusi et al. 2020a; Kusnick et al. 2020), this paper will introduce the genuine concept of the musiXplora to the digital humanities community.
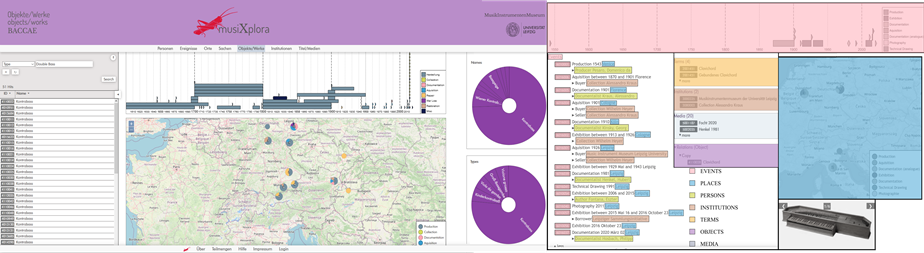
Figure 1: Webpage showing the overview of all objects of the double bass (German Kontrabass) type on the left and all linkages between facets for objects on the right (colored by target facet)
2. Background
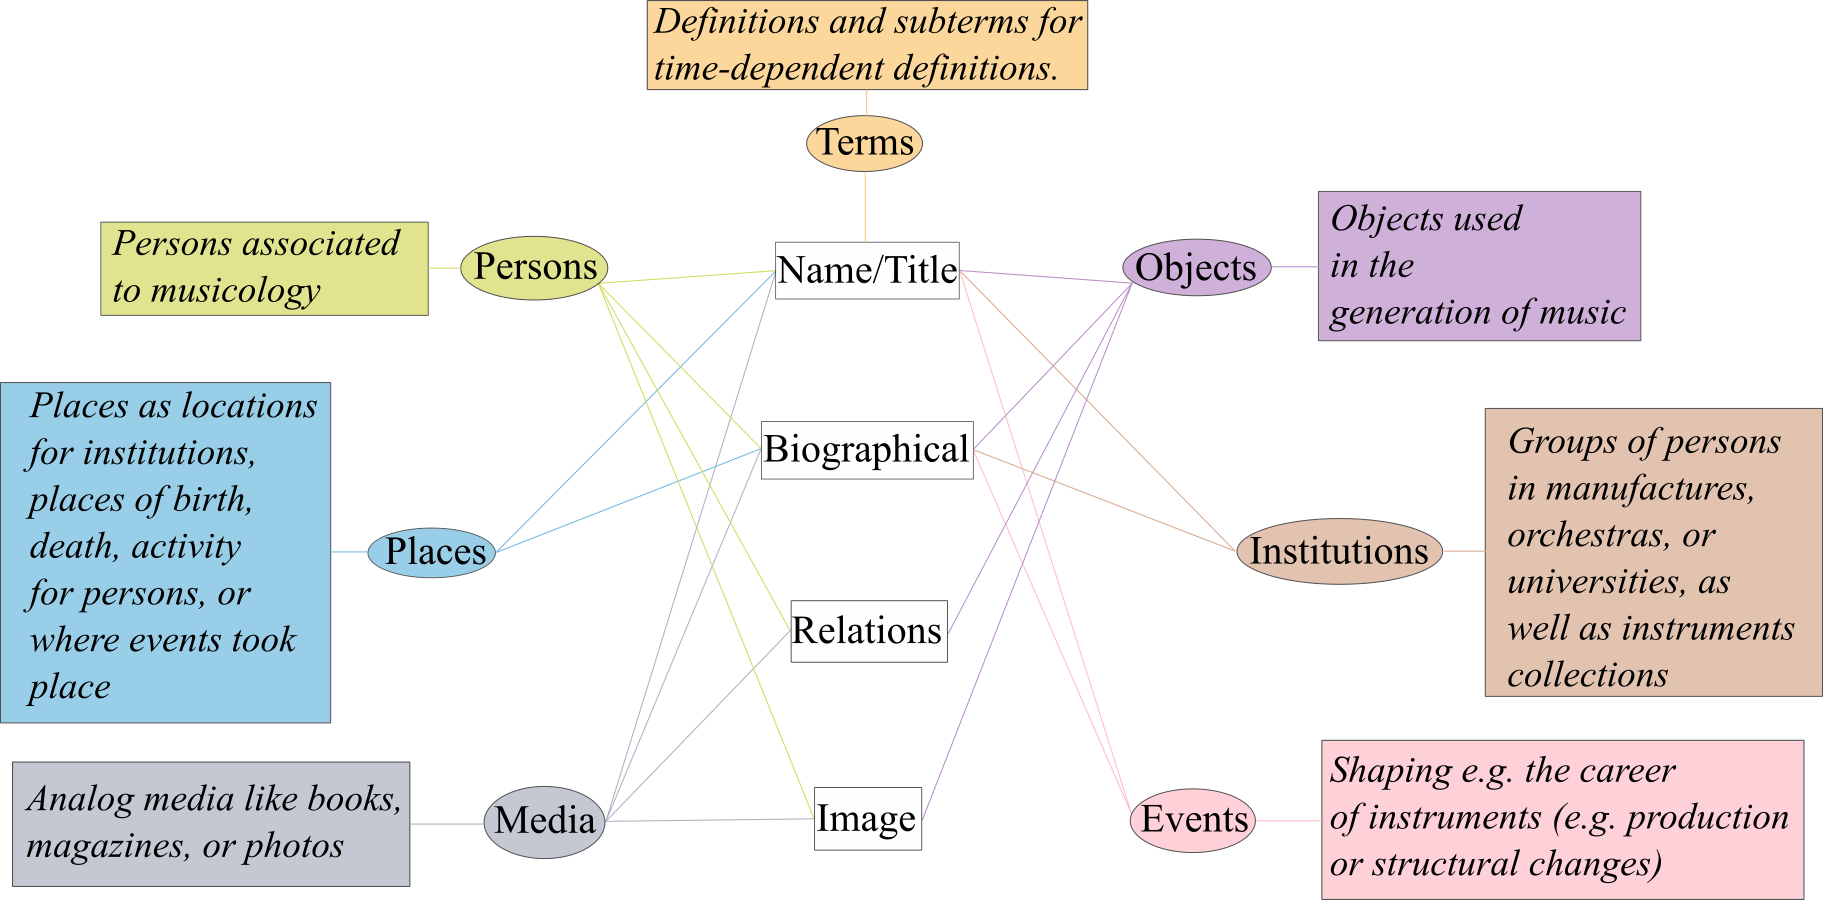
Musicology, a field that developed over centuries, cohorts different disciplines loosely linked by the human production of music. Today, the term musicology refers to subfields that may give insight to people associated with musicology (1), groups of people, or musical objects (2). Further, single musical objects being used to create music (3), as well as places of importance (4) for the development of musical concepts (5), and media containing this information (6). Lastly, important information for musicological analysis of the prior topics requires context. Especially the year or century inspected may have a decisive impact on the definition of terms (5) and analysis of events (7), changing their value and meaning.
For traditional musicology, it is rather unusual to look at global developments and linking information of different facets. This is propelled by the common use of printed media as a source of knowledge.
Due to the limited space available, sources are highly specialized. Information in a book may be about persons in a specific time-span or place. Quantitative analyses were dependent on the availability of printed media covering this particular topic or the general knowledge of the analyst. Also, the typical change of definitions in musicology makes analyses harder. Definitions of instruments may be context dependent. Changes in taste and trends lead to structural changes in how instruments were built or played.
Hence, given the temporal context of a source, the same term may refer to e.g. an instrument with five or six strings, or two different terms may be given for the same instrument (Khulusi et al. 2020a; Kusnick et al. 2020). This makes it very important to not just define a musical instrument (3), but also show its so-called career through events (7) and general changes of definitions (4).
Figure 2: Overview of the seven musicological data facets. A short explanation of each facet on the border as well as connections to types of data usually encountered inside a facet. All entities have a name or title, most biographical information or relations (connections to other entities of the same facet, as opposed to connections between different facets as seen in Figure 3). Lastly, some entities also have image data available
3. MusiXplora
To enable musicological data to profit from digital advantages – like making data publicly and easily available – and enabling computation, in 2004 a team of musicologists started digitizing data collected from print media and filling a database for seven facets (see Figure 2).
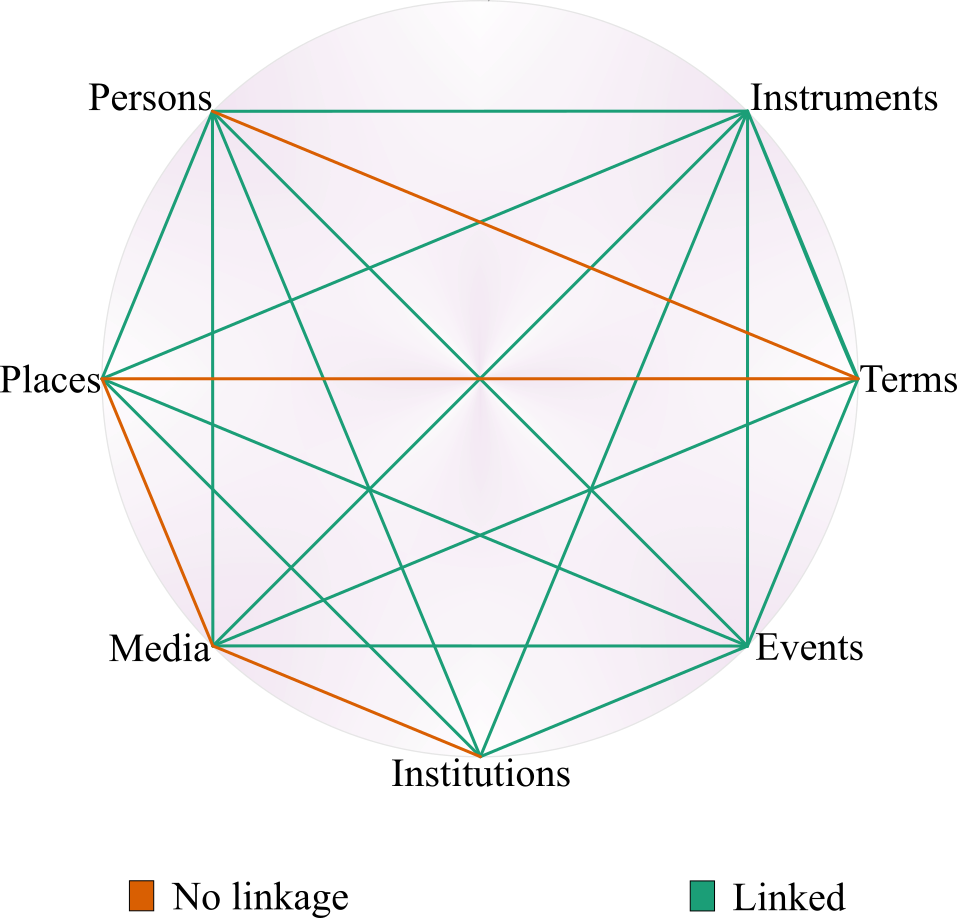
A detailed description of the single facets and which data they contain can be found in Khulusi et al.’s paper (Khulusi et al. 2020a). While up to this state, the musiXplora could be viewed as a purely digital version of traditional media, the linkage between entities of different types and their boundlessness is of the highest value. As stated in Section 2, traditional workflows are often limited by sources focusing on a narrow range of data, making it harder to review or analyze musicological quantitative aspects, gaining importance with digital humanities (Khulusi et al. 2020a). The “very high linkage between entities and facets” is the heart of the project. While a person usually is linked to multiple other persons (relations), he is also linked through events to instruments (maker), media (author), place (worked-in), or more. Figure 3 shows the possible connections between the different facets.
Through those, a user can also directly access relevant and high detailed information to the entity of interest in other facets. Figure 1 (right) shows examples of connections given for an instrument. The next section will cover some use cases in which it was necessary to break the traditional facets of musicology to analyze musicological history and developments.
Figure 3: Connections between different facets
4. Use cases
4.1. Verifying hypotheses
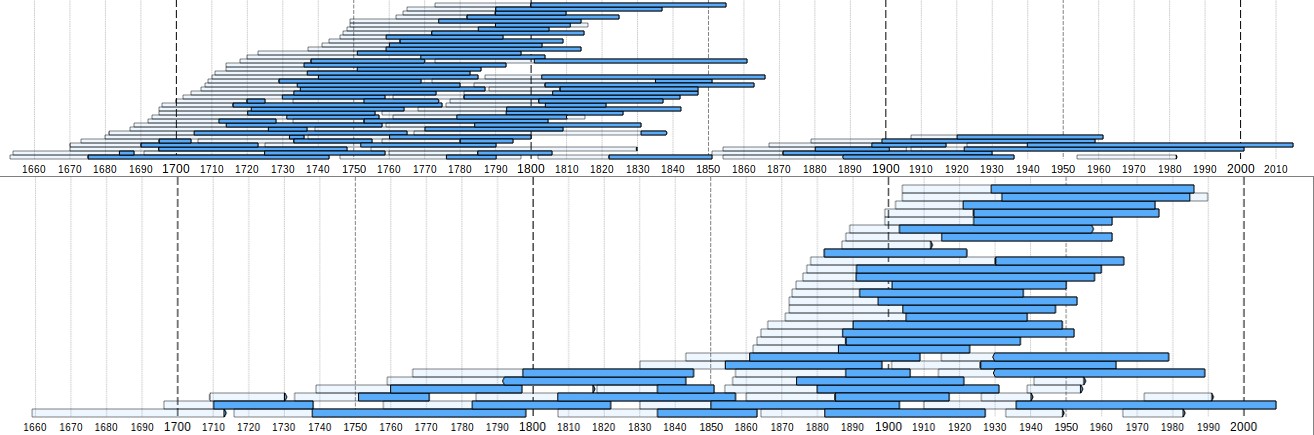
One central motivation of the visual analysis is the ability to obtain new insights and quantitative views on the collected data. A collaborating musicologist had the hypothesis that the lute profession underwent two major phases through history. The first, as lutes were played in court orchestras (pre 19th century) and the second was induced by historism (post 20th century). Through visualizing the lutenist profession, we can verify this hypothesis (Khulusi et al. 2019). A second hypothesis targeted the shift of location factors in the production of instruments throughout the centuries (Figure 4).
Figure 4: Excerpt from Khulusi et al.’s analysis of how the industrial revolution changed location factors for instrument production centers. Fussen and Mittenwald on the top as famous examples of pre-industrialization hotspots – close to rivers connecting the places widely – and Markneukirchen on the bottom as one of the big benefactors through an early industrialization by connection to the Middle German Train Network (Khulusi et al. 2020a)
Another musicologist is interested in jazz music and banjo players. When we asked him how he used the musiXplora, he showed a network graph of all banjo players and began a long explanation of how the visualization of the relations shows exactly what has only been existing in his mind beforehand. This includes that different genres can be seen through the collaboration relations and that specific musicians connect different genres (still in publication process).
4.2. Information lookup
A rather simple task is looking up information from the database. Sometimes, this is accompanied by the desire to get new knowledge or to better understand musicological concepts. For example, to review which events had an impact on the existence and success of institutions like the Bayreuther Festspiele (Khulusi et al. 2019) or how famous persons interacted between institutions like J.G.L. Mozart and his relation to the Correspondirende Societät der musikalischen Wissenschaft and Salzburger Court Orchester (Khulusi et al. 2019). Further, a question of the instrument makers working for Ludwig van Beethoven as a simple lookup was answered (Khulusi et al. 2020a). Through the visualization of his professional network, the musicologist could get easy insight into the people Beethoven worked with, which lead him to Streicher-Stein and further to instruments produced by her that are still preserved today. Also to be named is the Musiker Profiling project by Jänicke et al. (Jänicke et al. 2016). This tool, using the musiXplora database, allows for finding similar musicians by user-weighted criteria. Other lookup tasks focus on the organological aspects of the world’s oldest still preserved clavichord and a Viola d’Amore of unknown origin, shedding light on the careers and history of the objects (still in publication process). A last presented lookup dealt with piano rolls and showed their special case of having to be represented as both, instruments and media in the musiXplora (still in publication process).
4.3. Deriving new data
For specific cases, the musiXplora interfaces are designed to allow for generating new data. As an example, a visualization of existing relations between persons classified by their affiliation to institutions, or other biographical information like professions, allowed for deriving new relations by musicologists (Khulusi et al. 2019).
4.4. Browsing data
The last task in which we have seen users utilizing the musiXplora was a generic exploration and browsing of the data. Casually using the musiXplora, users inspect a random entity which sparks interest in further investigations (Khulusi et al. 2020a) or begins to compare different groups. As opposed to the first task described, here, musicologists do not have a specific claim in mind (Khulusi / Jänicke 2016), showing the musiXplora’s capacity to generate new hypotheses as well.
5. Collaboration
One of the major aspects of the musiXplora project was the close collaboration between musicologists and computer scientists. Starting with two people – a computer scientist and a musicologist –, the team expanded to a lead musicologist, responsible for the conceptual work, multiple musicologists and musicology students who work on the extension of the database and digitizing of musicological knowledge, and lastly, a team of computer scientists specialized in digital humanities and visualization. All three groups are collaborating closely to enable a suitable data structure, quality, and usefulness. The development process was a user-centred design (Abras et al. 2004), necessary to ensure intuitive usage of the system for domain experts (Gibbs / Owens 2012, Jänicke et al. 2017). Through 17 years, an iterative design process resulted in different approaches and extensions. Based on the collaboration, we were able to meet requirements from computer scientists’ perspectives as well as musicologists’ needs. We learned that especially visualizations offer great access to new research questions and are of high interest for musicologists worldwide.
6. Conclusion
Since its public release a couple of years ago, we could see an increase in the usage of the musiXplora in the daily workflows of musicologists (more than 25,000 visits since 2018). Next to our collaborating musicologists, today we get access from people worldwide. This, next to the numerous named use cases in Section 4, shows the musiXplora’s value for people interested in musicology and can be viewed as an example of how the digital humanities bring together computer sciences and humanities, enabling new opportunities for researchers and other interested people. The range of possible (research) questions and the variety of supported tasks – for which traditional means are limited and laborious – is vast. It has been documented that the musiXplora is a resource to support qualitative research, to help to build abstract concepts and to generate hypotheses, as well as quantitative inquiries.
We want to emphasize that this paper only reflects the present state. Current extensions deal with e.g. offering an API, localization, or new tools helping the musicologists not only in digitizing more data but also in semi-automatic extraction of data up to date not accessible, due to its sheer amount that exceeds human capabilities.