1. Introduction
Why do some regions industrialise earlier, or more definitively, than others? How does this process compare in distinctively different parts of the world, Europe and China, and what does this tell us about the nature of their economies and the building blocks for sustained economic growth in general?
These questions are central in the ERC-funded research project ‘The Historical Dynamics of Industrialization in Northwestern Europe and China ca. 1800-2010: a Regional Interpretation’ (http://www.worldeconomichistory.org). One of the points of focus in this research project has been the role of transportation networks. In other words, to what extent are new advances in transportation, from road building to the emergence of railway networks, key in explaining regional differentiation in industrialisation?
To answer this question for East Asia, and China in particular, the project has gathered a large body of historical statistics on industrialisation and the manufacturing sector. These statistics, involving data from individual factories or aggregated statistics on county-level, will be linked to models of historical travel times and transport costs in order to study their mutual connection. Is regional industrialisation heavily dependent on the level of integration and connectedness of an area in a multimodal (road, waterway, railway) transport network? What other factors could be important? How did the rapid introduction of an extensive railway network at the beginning of the twentieth century influence the establishment of manufacturing centres?
An essential part of the wider project, is the reconstruction and modelling of these historical travel times. These reconstructions will be the main subject of this presentation. It uses a combination of unique historical maps of the Chinese provinces from the late 1930s, historical statistics of actual travel times and their modes of transport, and extensive GIS techniques.
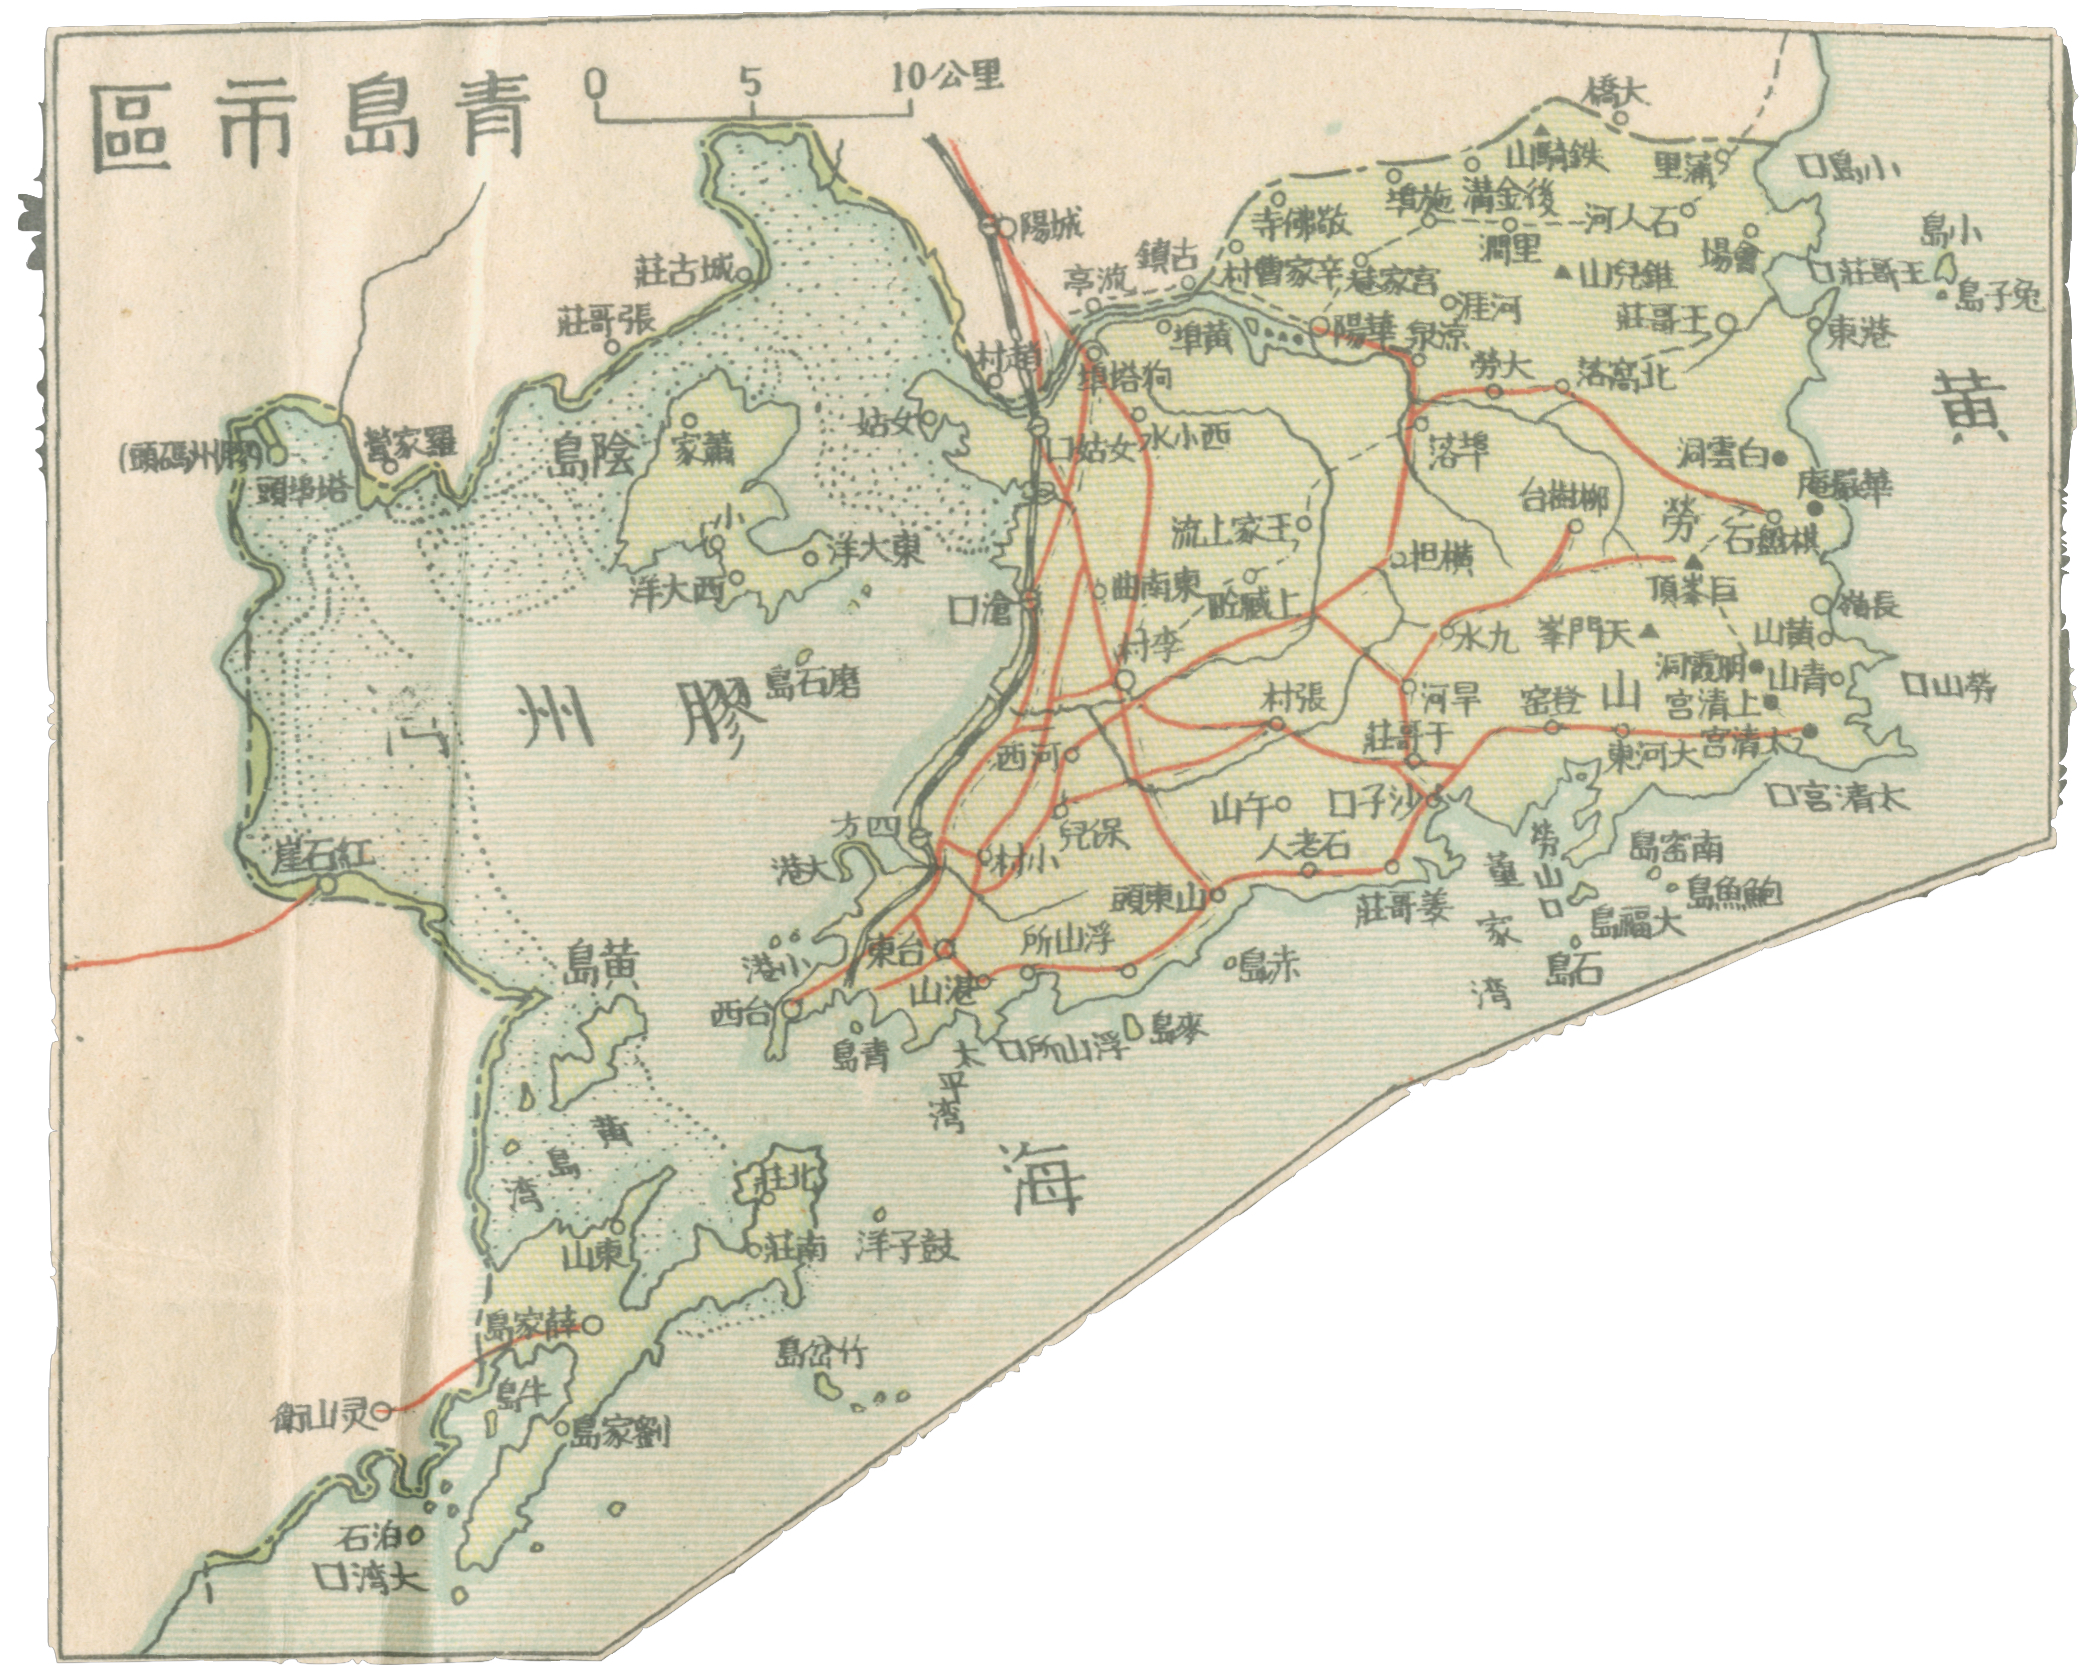
Figure 1: Transportation network for the Qingdao city province.
2. Data preparation
The historical base maps were made around 1938 by the New-Asia Association of Geography (亚 新地学社), which were specially acquired by the IISH. Each map represents one of the thirty Chinese provinces at the time (which included present-day Mongolia), whereas an overview map also includes main transportation links to neighboring countries (Russia, India, South East Asia, Korea, Japan). The maps include transportation routes (main roads, secondary roads, railroads, and rivers), the main localities, as well as simplified county boundaries.
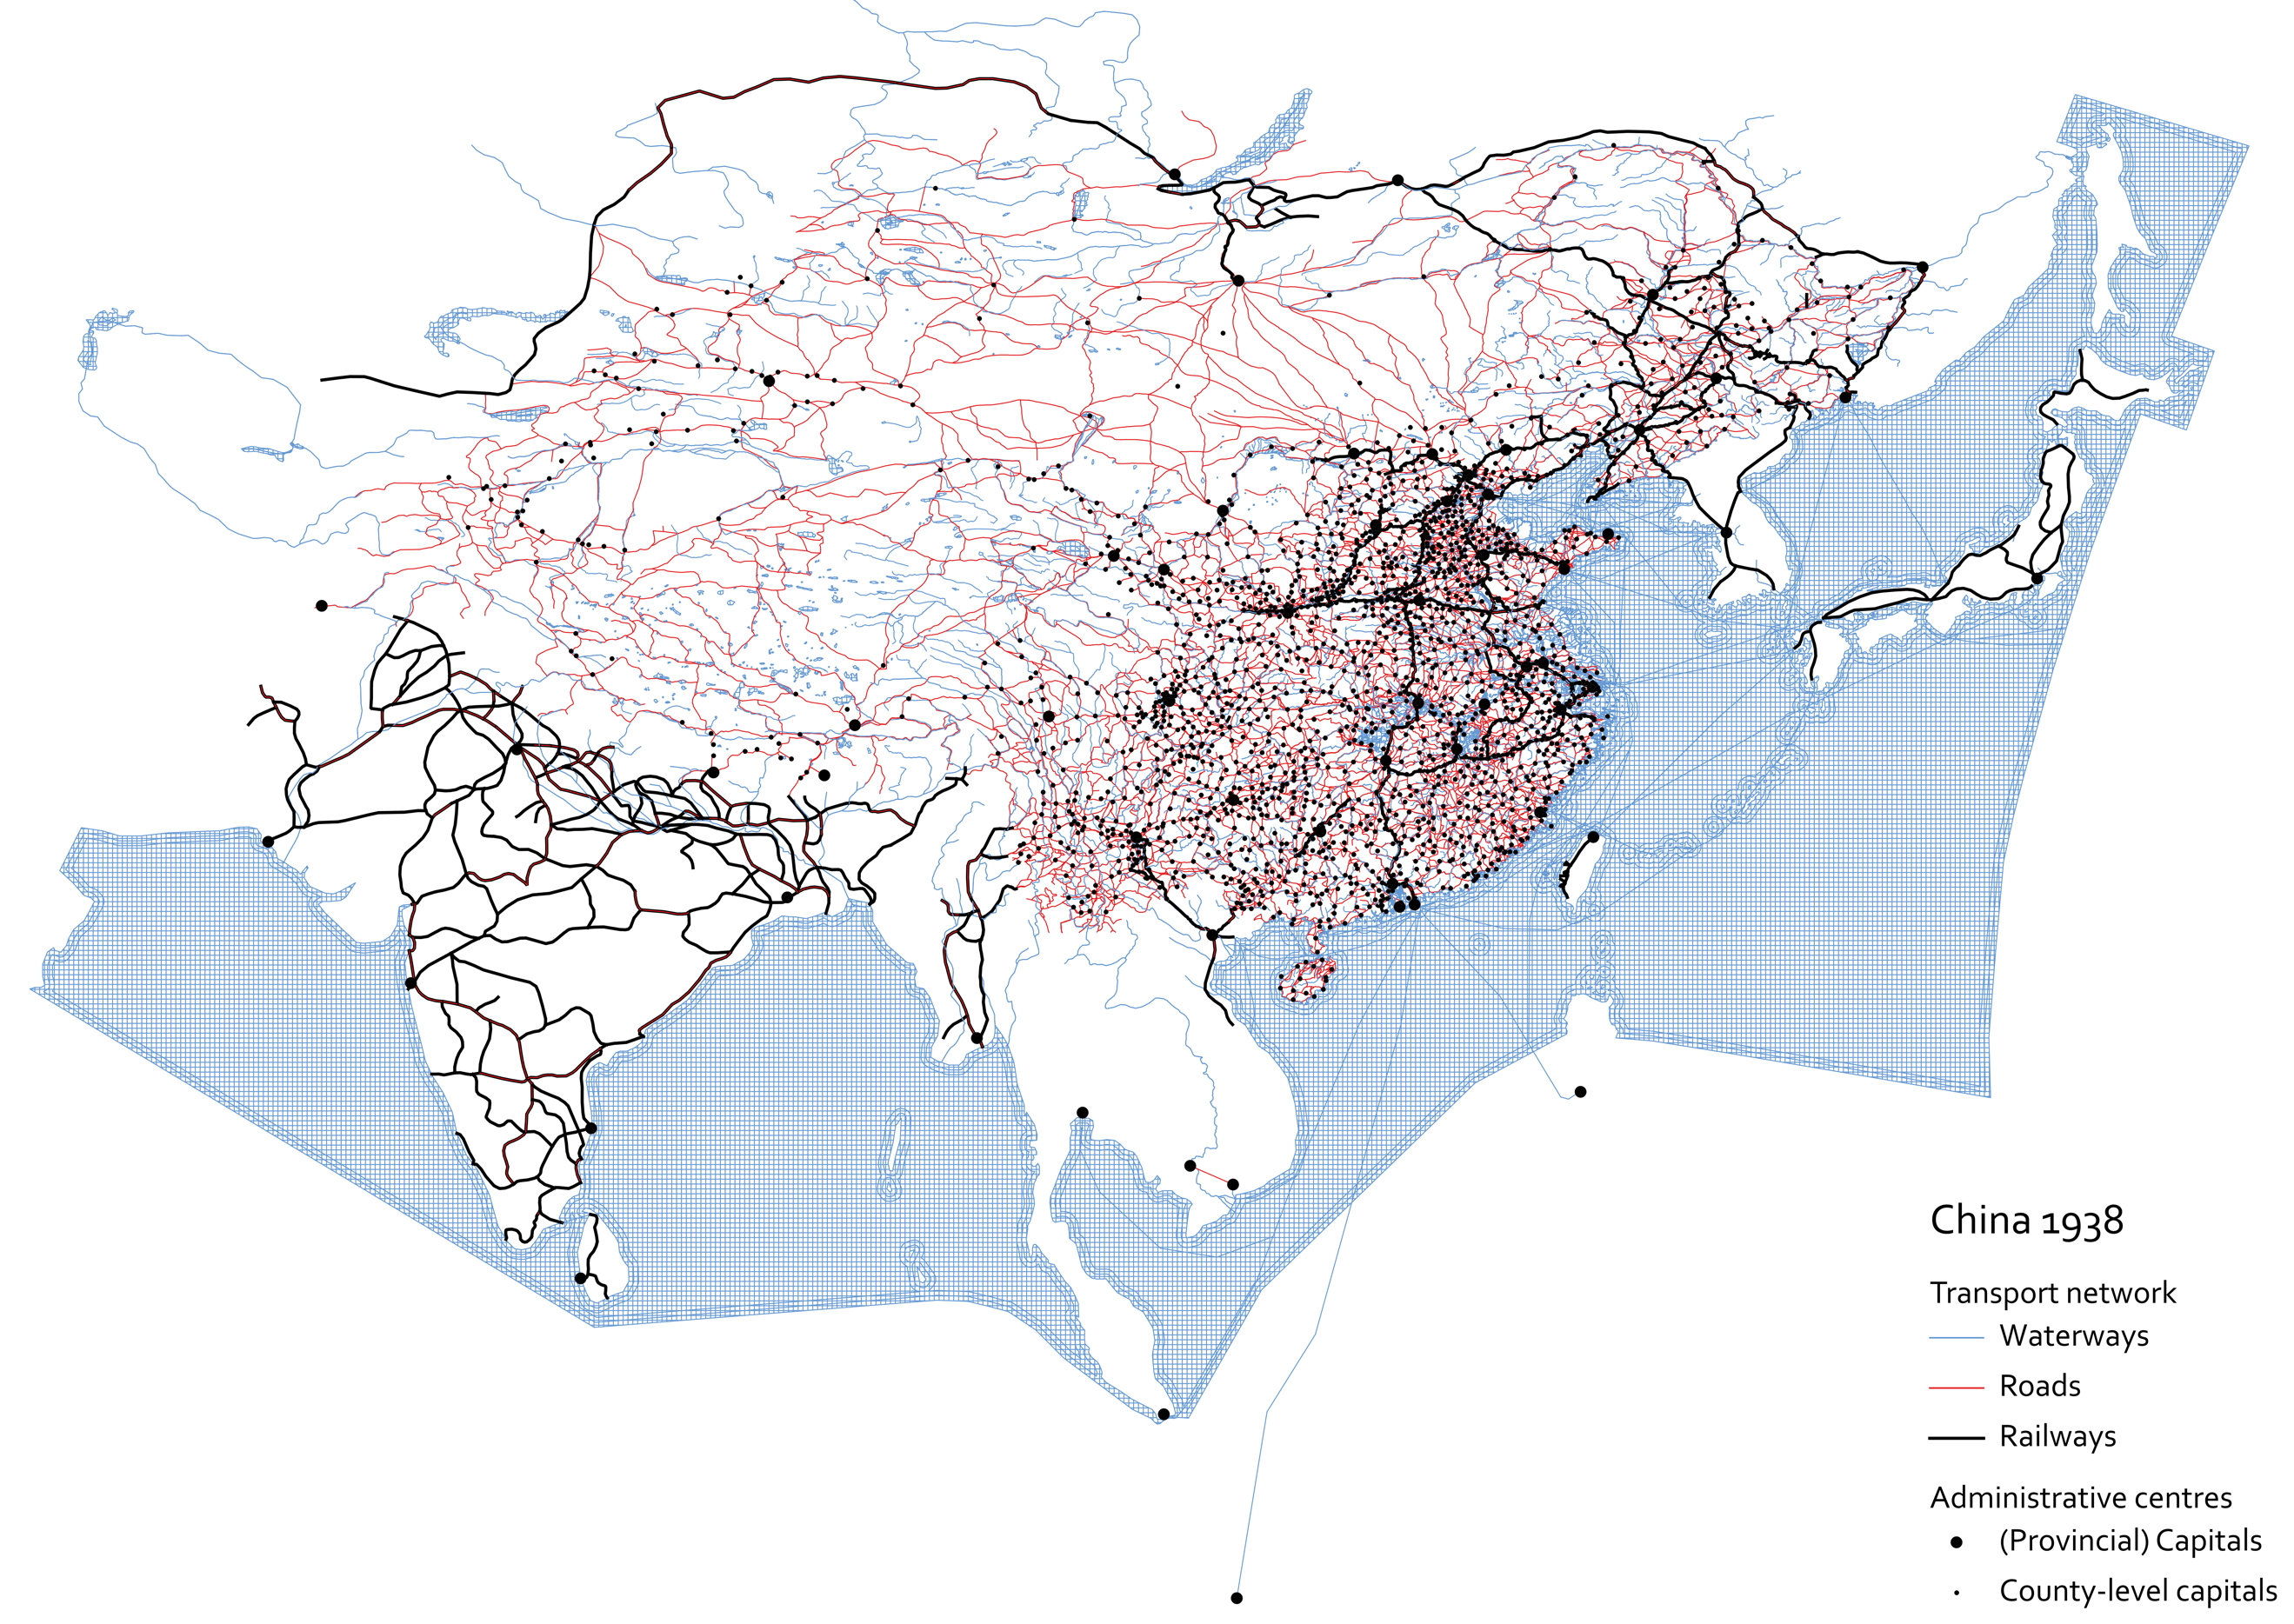
The first stage was to digitize and georeference the maps. Subsequently, all map features of interest for our specific purpose – creating a model of travel times between county and province capitals in 1930s China – were vectorized. This process was done manually by hand with help of our research partners in China. Apart from the different categories of transport routes (Table 1), all 2000+ administrative centers (province-, district-, and county- (or county-equivalent) capitals) were also digitized. Afterwards, the geodatabase was cleaned for topological errors, the direction of rivers was made consistent with up- or downstream directions, etc. Figure 2 presents the extent of the network.
Table 1: Digitized transportation categories.
*) A river is classified as 'primary' when both sides of its shores are drawn separately on the map.
**) A river is classified as 'secondary' when in the Global River Database (Andreadis et al. 2013) "a_AREA" > 9000 and "a_DEPTH" > 2 and "a_WIDTH" > 100. In some cases, these criteria were not followed strictly, in order to create contiguous stretches of river. In all other cases, the river is classified as a tertiary river.
***) When routes end at either side of a river, but no evidence of a bridge or crossing is present, a river ferry is assumed.
Figure 2: Transport network China and East Asia 1938.
3. Gazetteer, relief energy, network modelling
A problem with these cartographic sources was that they are not always topographically very precise, especially for some of the more remote provinces. Their main function was to provide a schematic overview of the Chinese provinces at the time, rather than providing correct topographic maps. This means that the localities and routes extracted from the maps provide only a schematic view. Yet, such a schematic view is sufficient if we look at the macro-level (i.e. China and its surrounding countries as a whole).
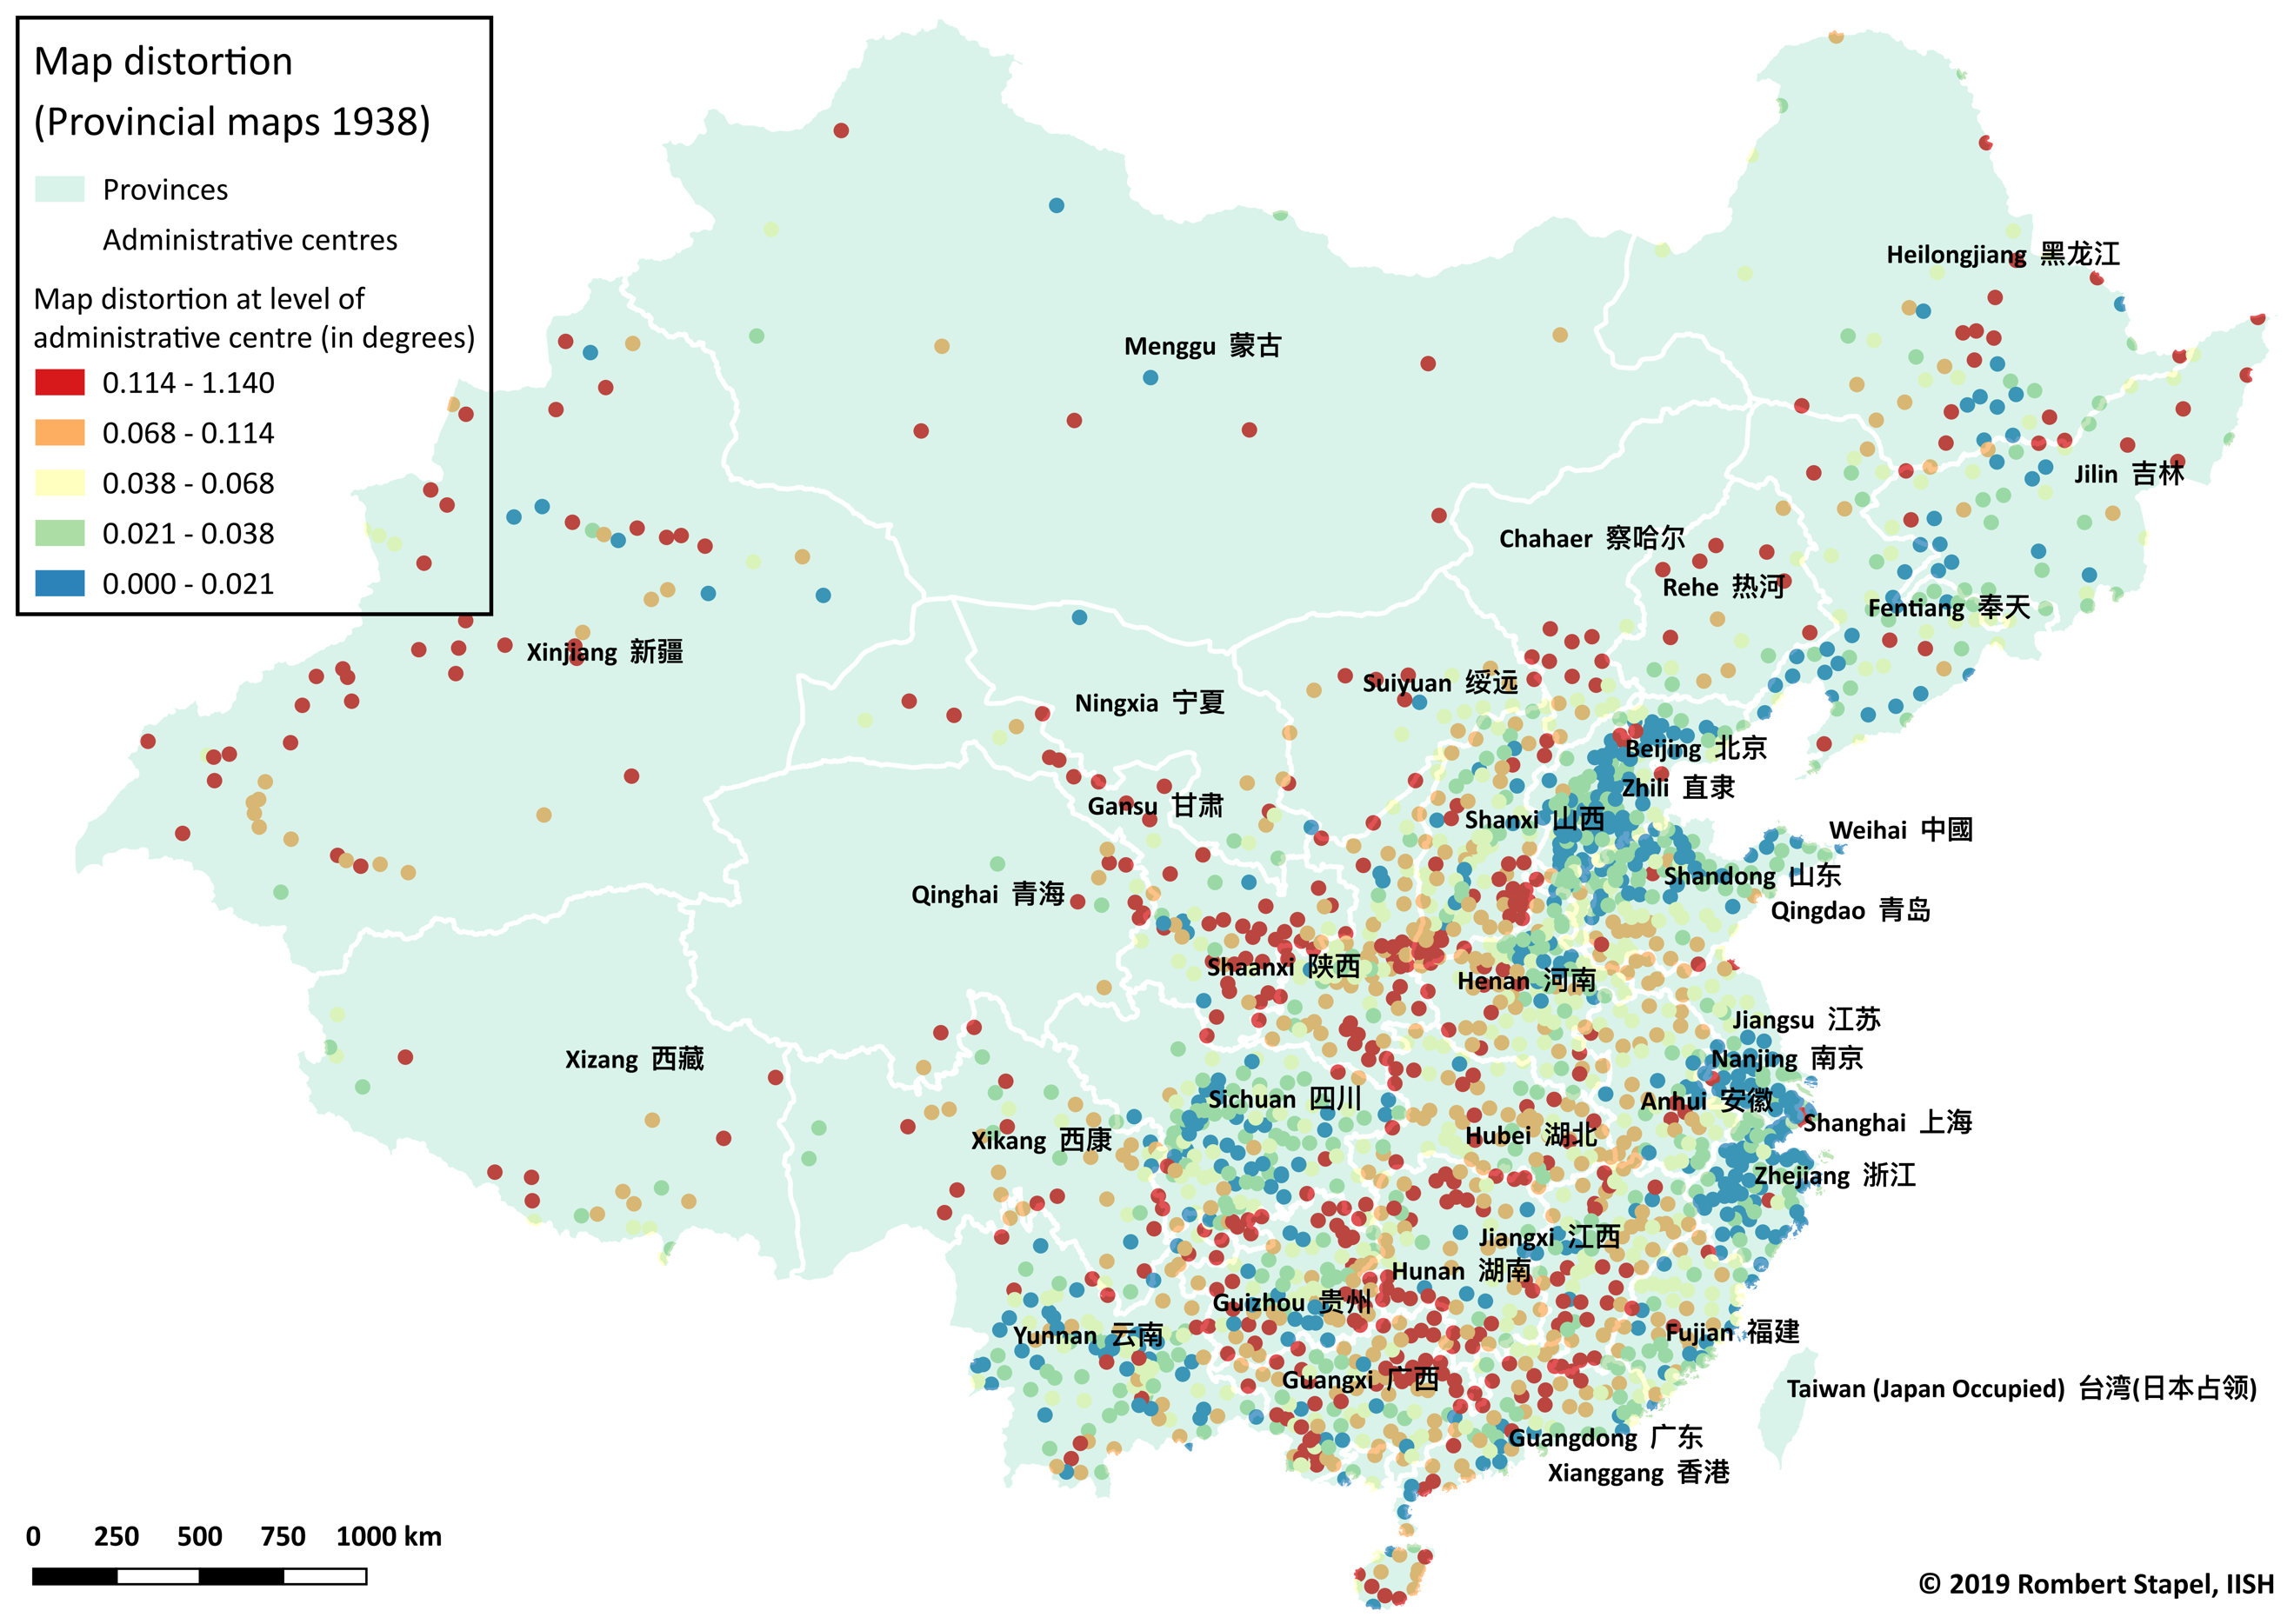
To link the administrative centres (hubs in our network) to the actual locations of associated places, a link was made between our dataset and the China Historical GIS, which has an extensive historical GIS for China in 1911 – including the actual location of administrative centres (http://chgis.fas.harvard.edu/). Between 1911 and 1938, there are numerous changes made to the administrative classification, which means that some intermediate steps were needed, as well as a manual check afterwards. Since the georeferenced location of our main transport hubs can now be compared to their actual location, it is also possible to visualise the distortion of the maps (Figure 3).
Figure 3: Map distortion: difference between georeferenced location of county- and province-capitals and their actual location.
Due to these distortions, it is also difficult to link our georeferenced routes to present-day digital elevation models (DEM), which will be necessary to accurately estimate the historical travel times in areas that are not flat. After all, the average relief energy (difference between the highest and lowest point in a designated area) is likely to influence travel times greatly. We have been experimenting with work-arounds to this problem, which will be addressed briefly at the conference.
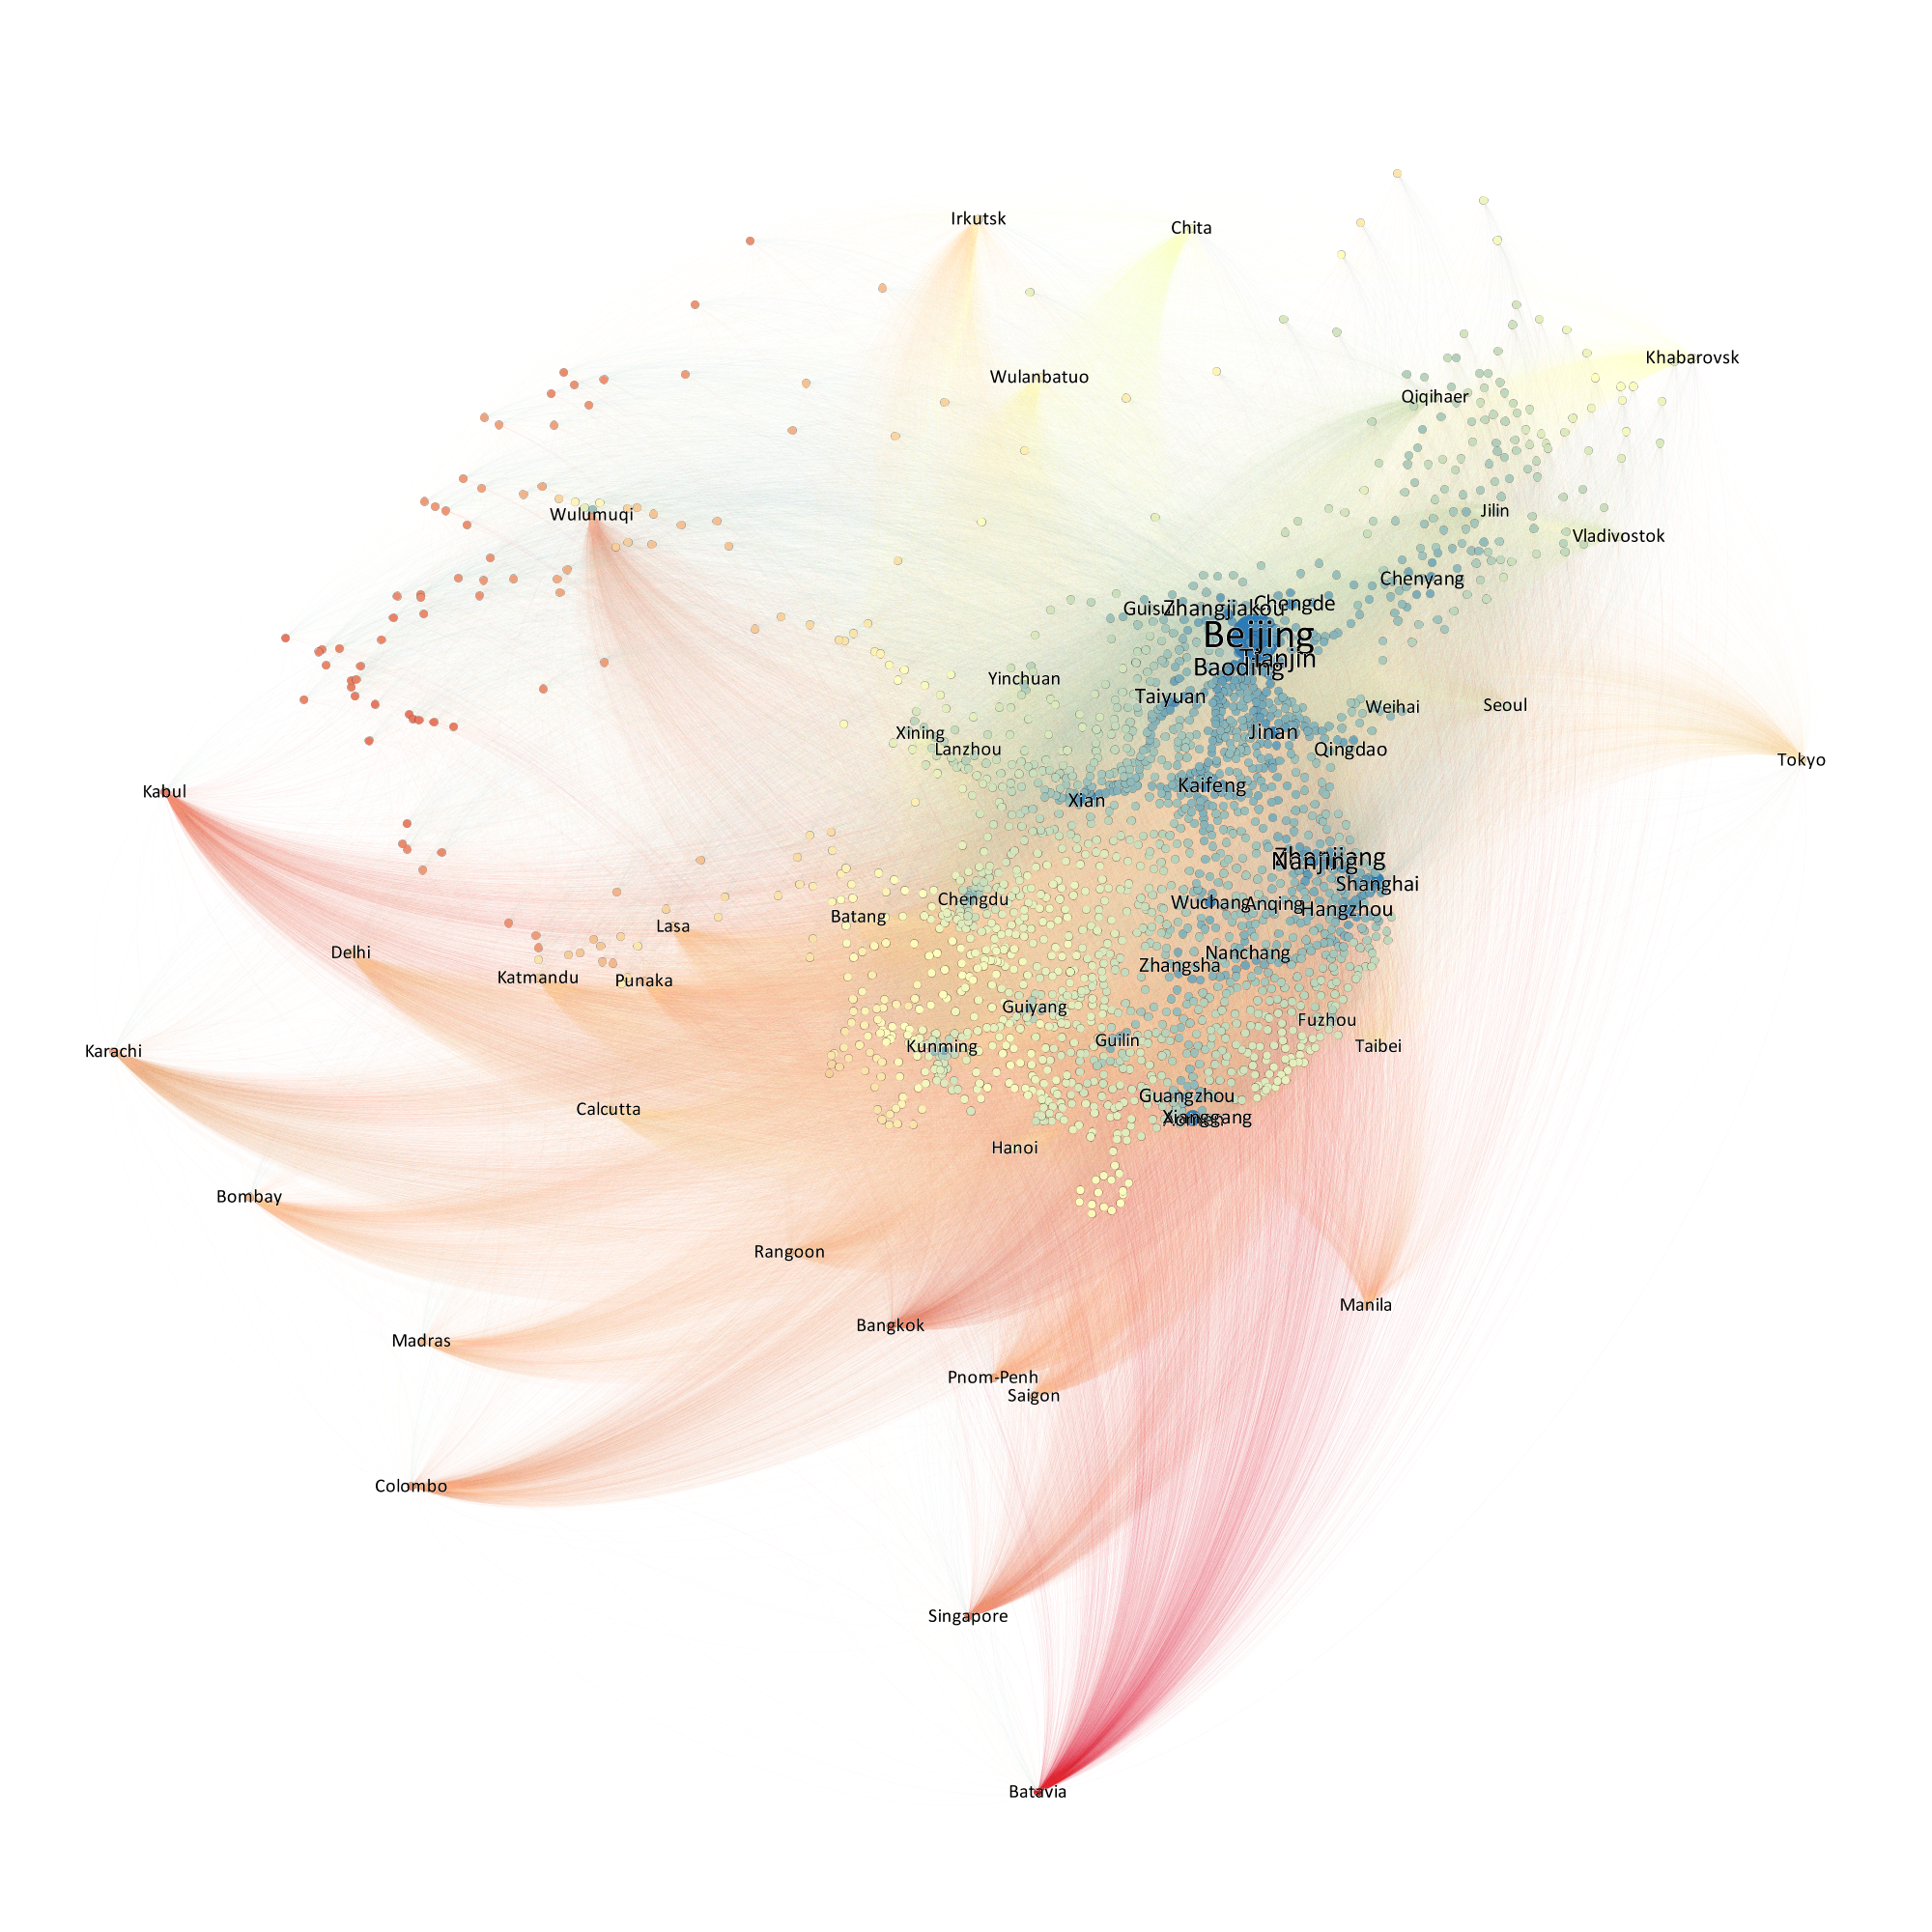
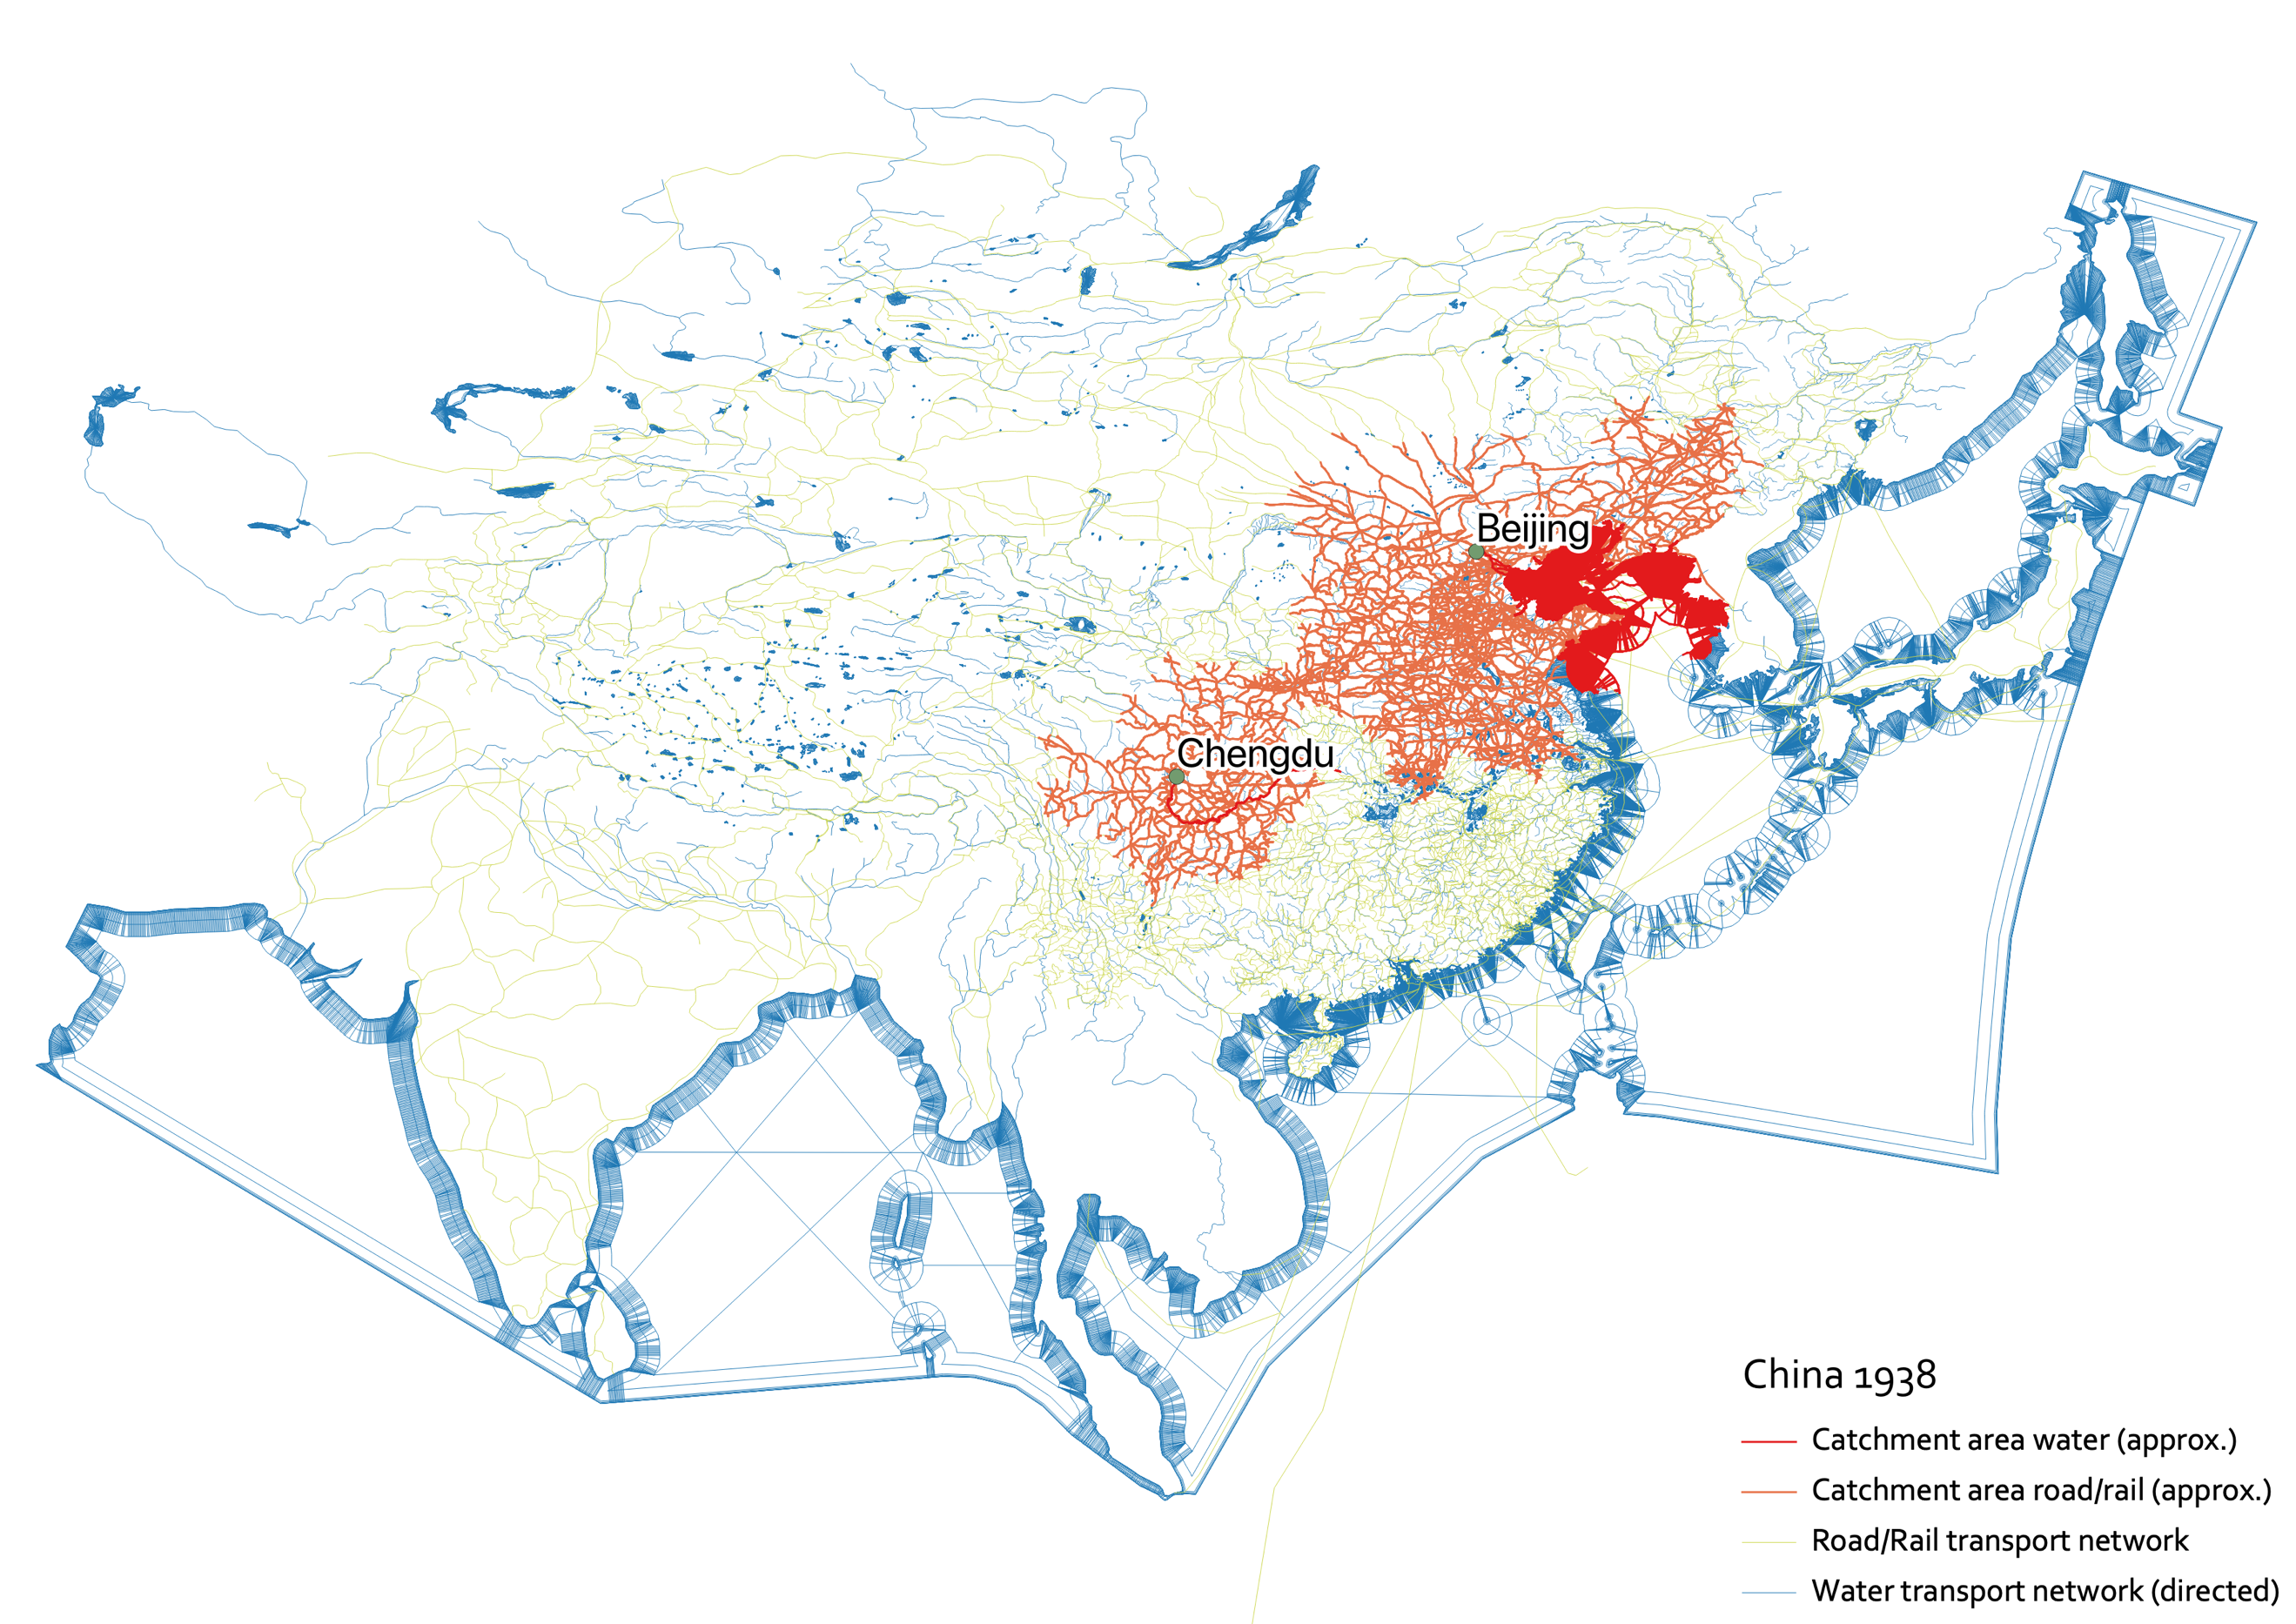
The final and most important stage of this research project is to link our GIS transportation network to historically accurate travel times per transport category (Table 1). In other words, how fast could one travel per train in 1938? What is the difference between the travel speed on primary and secondary roads? For this, we have collected thousands of real-world travel times (by road, by train, or by boat) in China in the 1930s, which we used to enhance our GIS model. In the end, by using network modelling features in the QGIS software package, we are able to reconstruct travel times between the 2000+ administrative centres. This allows us to make new analyses, for instance on the nature of the Chinese and East Asian transport network in the 1930s, during the height of its industrialisation (e.g. Figure 4 & 5).
Figure 4: Weighted out-degree of county- and province-capitals in China and Mongolia, as well as important localities in East Asia.
Figure 5: Approximate catchment areas of Chengdu and Beijing, by land and by water.